Customize your chart
X.A.
2018-06-23
Customize chart.RmdGallery
Jazz
showtext::font_add_google("Homemade Apple", "Homemade Apple")
showtext::showtext_auto()

# Classic ggplot part
count(mtcars, carb) %>%
  ggplot(aes(carb, n)) +
  geom_col(fill="#223583") +
  labs(title="Number of cars by carburator count") +
  theme_gray(base_size = 16) +
  theme(panel.background = element_rect(fill="#E7E7D3")) -> p

# ggRough part
options <- list(
  Background=list(roughness=12),
  GeomCol=list(fill_style="solid", bowing=0, roughness=6))
get_rough_chart(p, options, family = "Homemade Apple", font_size_booster = 1.45)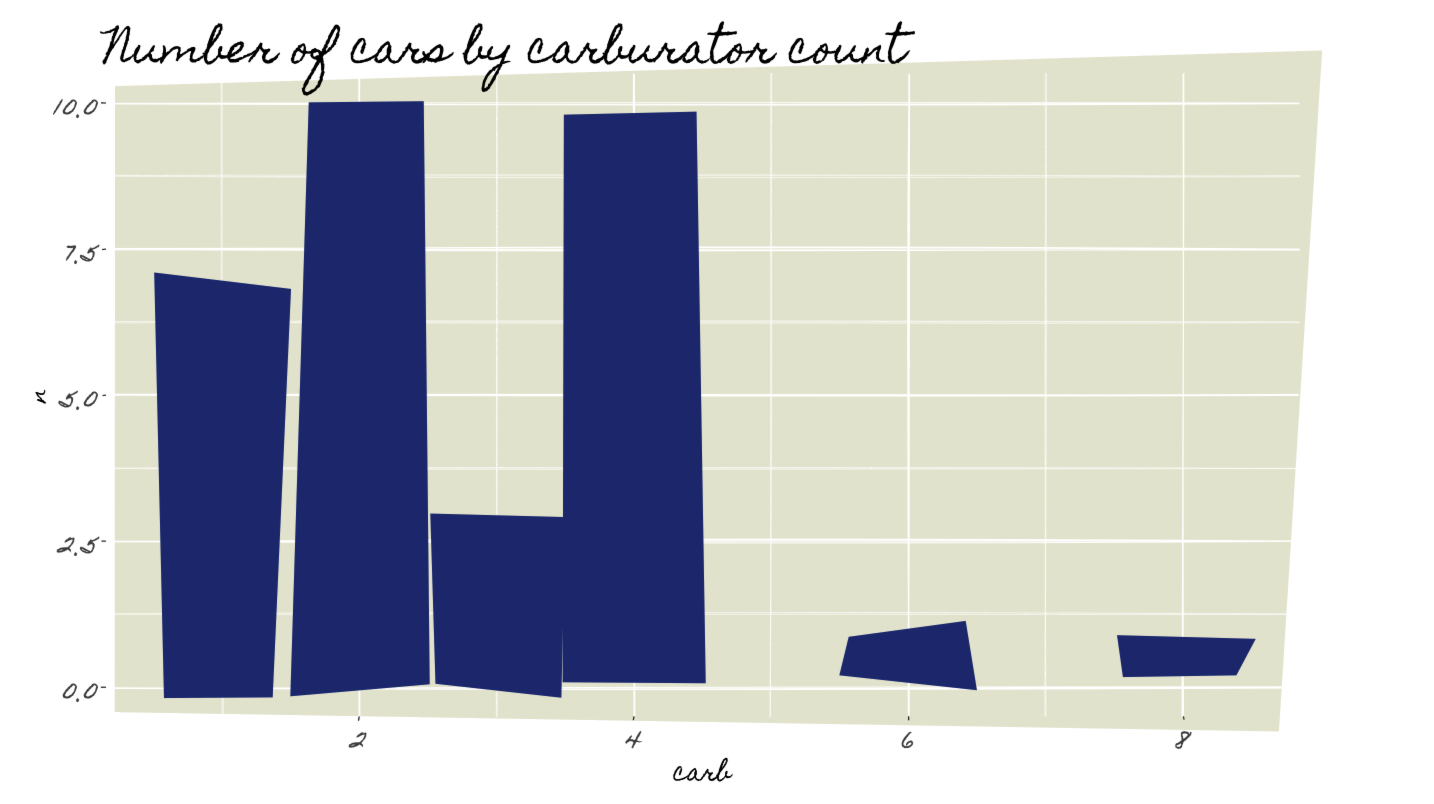
Blueprint
showtext::font_add_google("Rock Salt", "Rock Salt")
showtext::showtext_auto()

# Classic ggplot part
count(mtcars, carb) %>%
  ggplot(aes(carb, n)) +
  geom_col(fill="snow") +
  labs(title="Number of cars by carburator count", subtitle="") +
  theme_gray(base_size = 16) +
  theme(text = element_text(colour = "snow"),
        axis.text = element_text(colour = "snow"),
        plot.background = element_rect(fill="#223583"),
        panel.background = element_rect(fill="#223583")) -> p

# ggRough part
options <- list(
  GeomCol=list(fill_style="hachure",  angle_noise=0.8, gap_noise=0.2))
get_rough_chart(p, options, family="Rock Salt", font_size_booster = 1.4)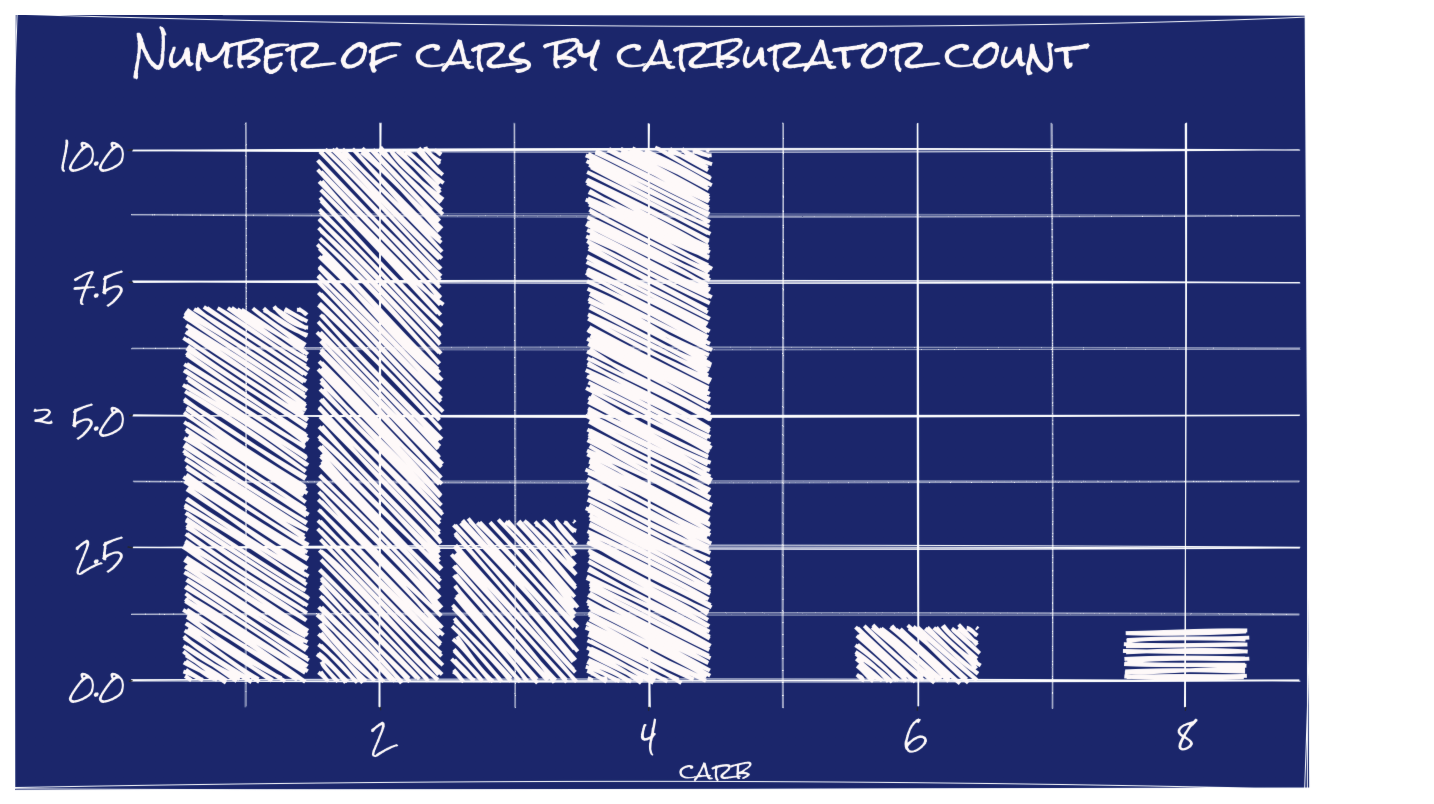
Kindergarten
showtext::font_add_google("Schoolbell", "Schoolbell")
showtext::showtext_auto()

# Classic ggplot part
ggplot(uspopage, aes(x=Year, y=Thousands, fill=AgeGroup)) +
  geom_area(alpha=0.8) +
  scale_fill_ipsum() +
  scale_x_continuous(expand=c(0,0)) +
  scale_y_comma() +
  labs(title="Age distribution of population in the U.S., 1900-2002",
       subtitle="Example data from the R Graphics Cookbook",
       caption="Source: R Graphics Cookbook & hrbrthemes") +
  theme_ipsum_rc(grid="XY") +
  theme(axis.text.x=element_text(hjust=c(0, 0.5, 0.5, 0.5, 1)),
        legend.text = element_text(size=12)) +
  theme(legend.position="bottom") -> p

# ggRough part
options <- list(GeomArea=list(fill_style="hachure",
                              angle_noise=0.5,
                              gap_noise=0.2,
                              gap=1.5,
                              fill_weight=1))
get_rough_chart(p, options, family = "Schoolbell", font_size_booster = 2.4)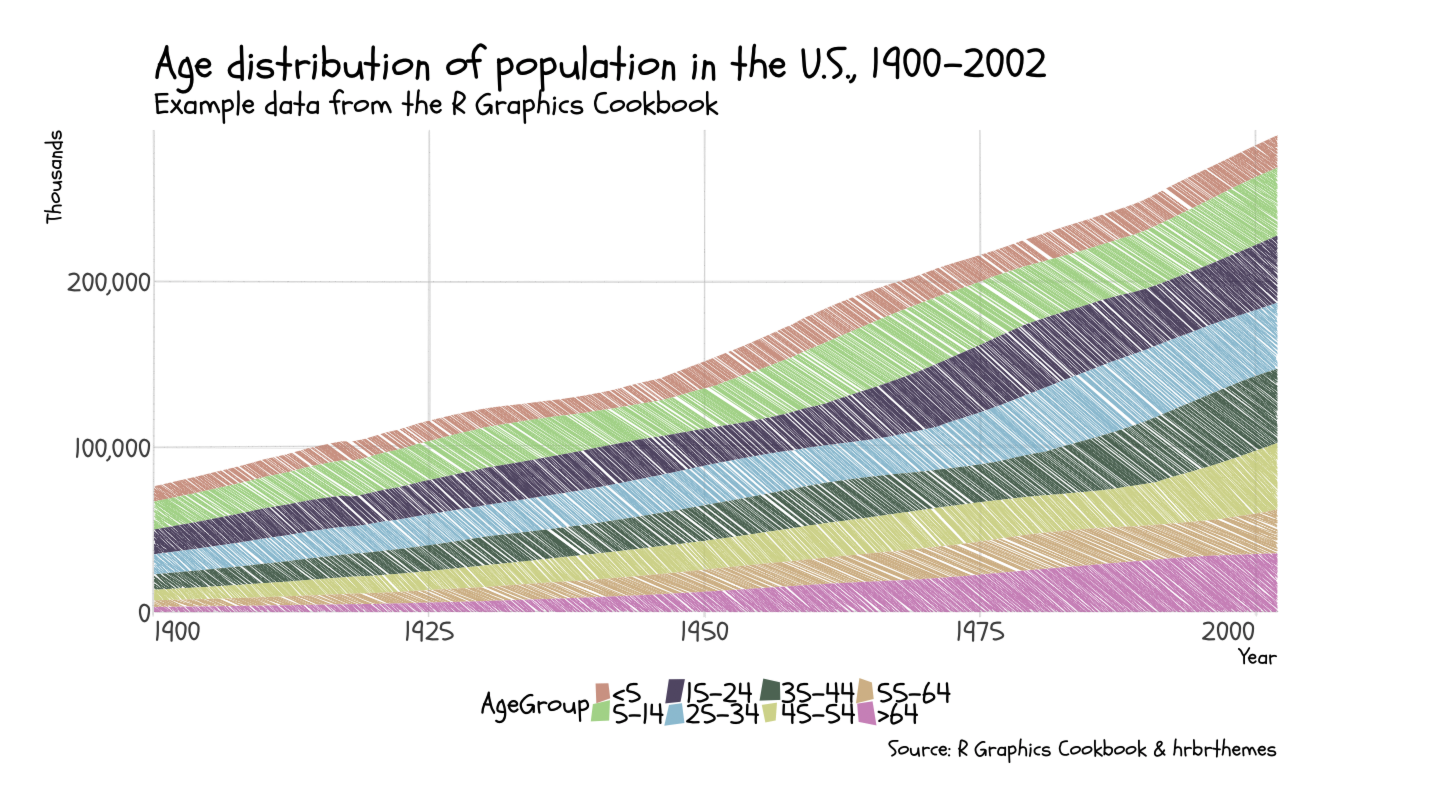
Options
The first argument of get_rough_chart is the ggplot2 chart object that you want to modify.
The second argument is a list of lists of ggrough options (one list for defaults, one list for Background and one list per geom type). The options you can use are listed below. Things not listed (e.g colors, alpha…) are inherited from the ggplot2 chart.
Lastly, you have direct access to two helper arguments that let you change the font (family) and the font size (font_size_booster).
How to write the options list
The example below changes:
-
roughnessfor theBackground(plot.background,panel.background,panel.grid…) -
fill_style,bowingandroughnessfor allGeomCol
Fill Style — fill_style
For closed shapes (i.e rectangle, circle, closed paths…), you can choose between:
solidhachurecross-hatchzigzag-
dots(currently only work with GeomCol)
Default is solid.
Gap Noise — gap_noise
A percentage of noise to apply on the gap value. Use a value between 0 and 1. A gap_noise of 1 means that deviation up to 2 * gap are allowed.
Default is 0.
Angle Noise — angle_noise
angle_noise is a value between 0 and 1, equivalent to the percentage of possible deviation from the set angle. An angle_noise of 1 means that deviation up to 90° are allowed.
Default is 0.
Font family — family
You might be tempted to use brush and cursive font more than usual. If you are using a theme, it can be a pain to change the font family. If all you want is to replace all font by a chosen family, you can do it with the family argument in get_rough_chart.
To use Google fonts, try the fantastic showtext package.
Font size — font_size_booster
Fonts get a bit smaller during the conversion. To compensate, you have two options.
- You can make the text bigger in your ggplot chart.
- Or you can use the
font_size_boosterargument inget_rough_chart.
If you use the font_size_booster argument, you will need to provide a theme. If you just want to use the default grey theme, you can call it explicitly with + theme_grey() or + theme_gray().