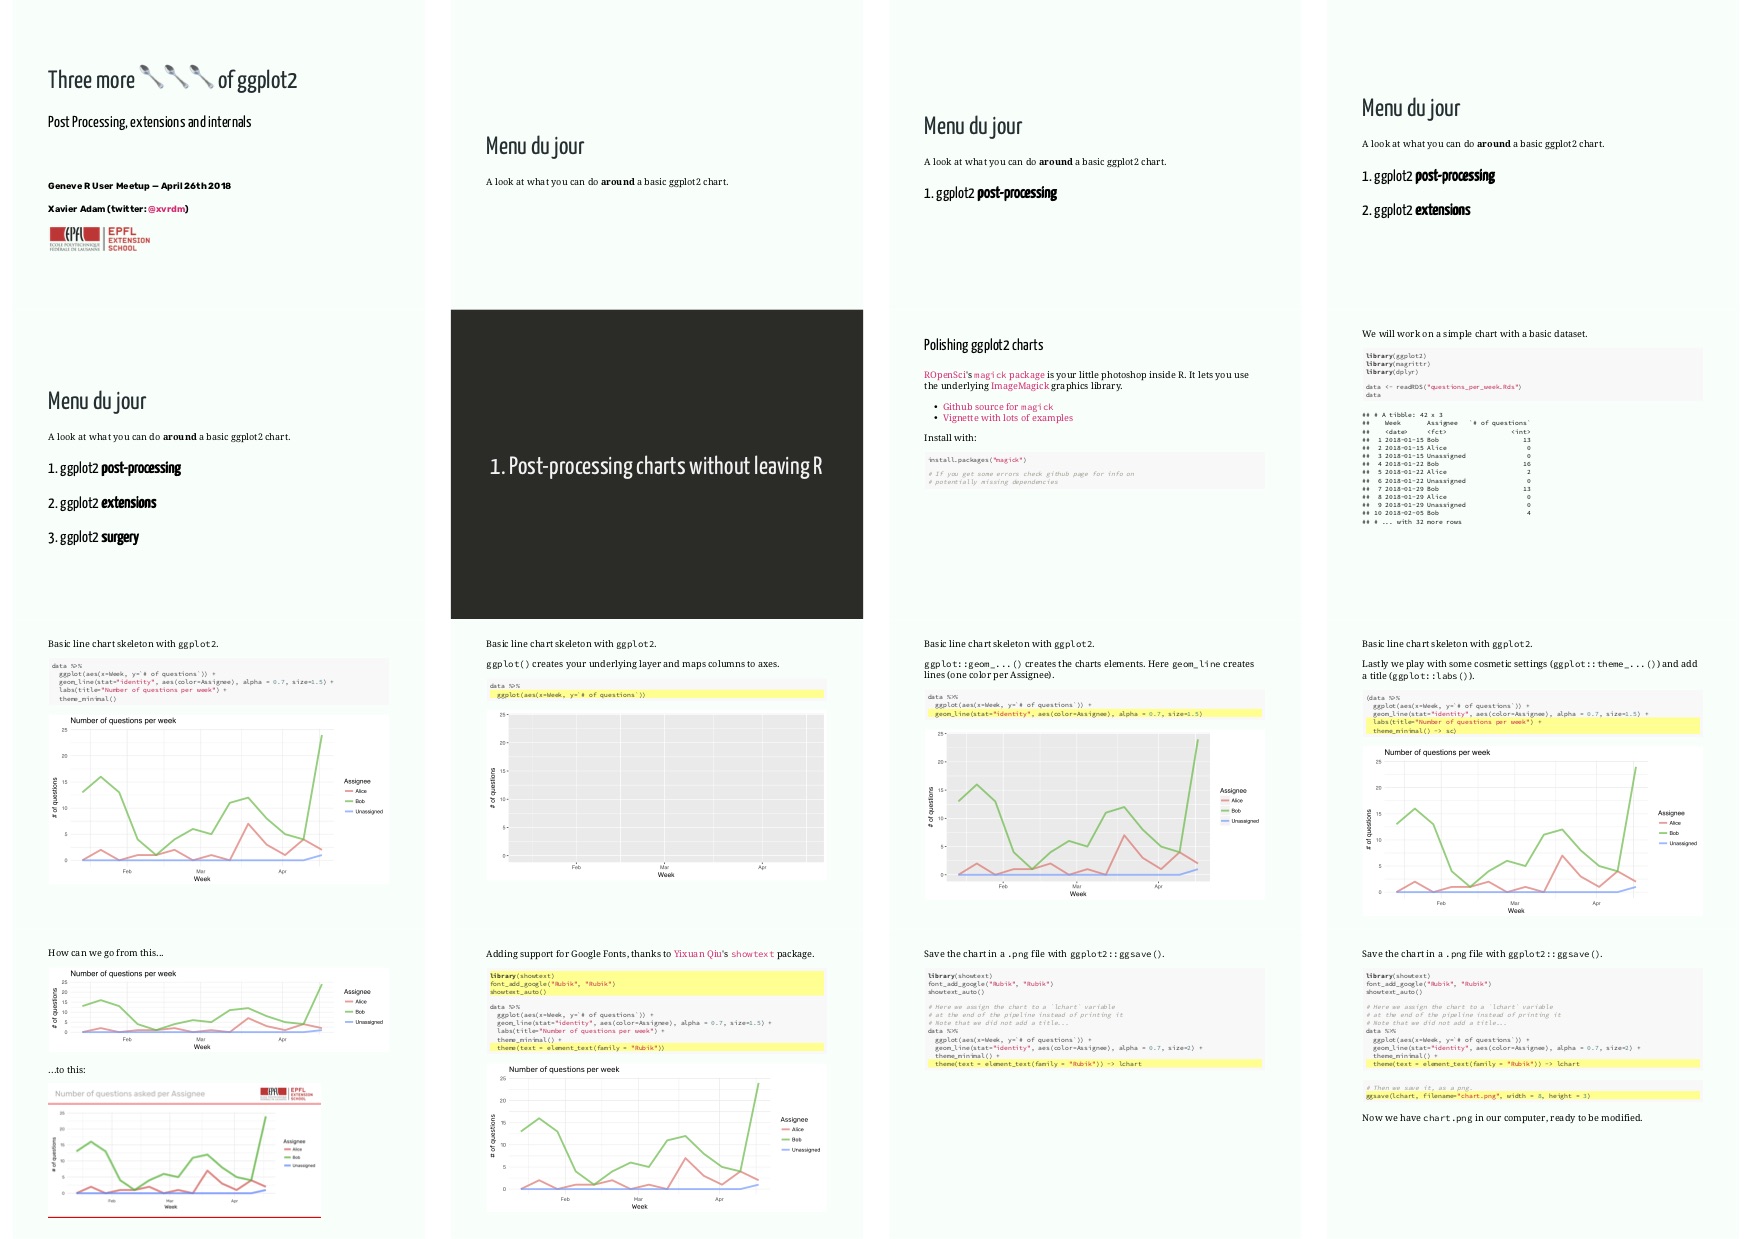
I gave a talk at the first Geneva R Users Meetup about pushing ggplot2 charts further by:
- post-processing images with the
magickpackage - using extensions to create animations
- tentatively pocking in the internals
You can find the slides here.
Note that the
gganimatepackage has since been completely rewritten by Thomas Lin Pedersen, also mentionned in the deck. You will find more documentation about the new API on the official website.
