Introduction
The offers on real estate websites aren’t always in an easy-to-use format, especially if you want to compare offers from multiple agencies.
In this post, we will see how to use R to scrape the details about the apartments listed on a single page on a real estate website.
Scraping the data
Getting to know the site
We start by looking at the real estate agent website. The section containing apartment rental offers can be found at this URL.
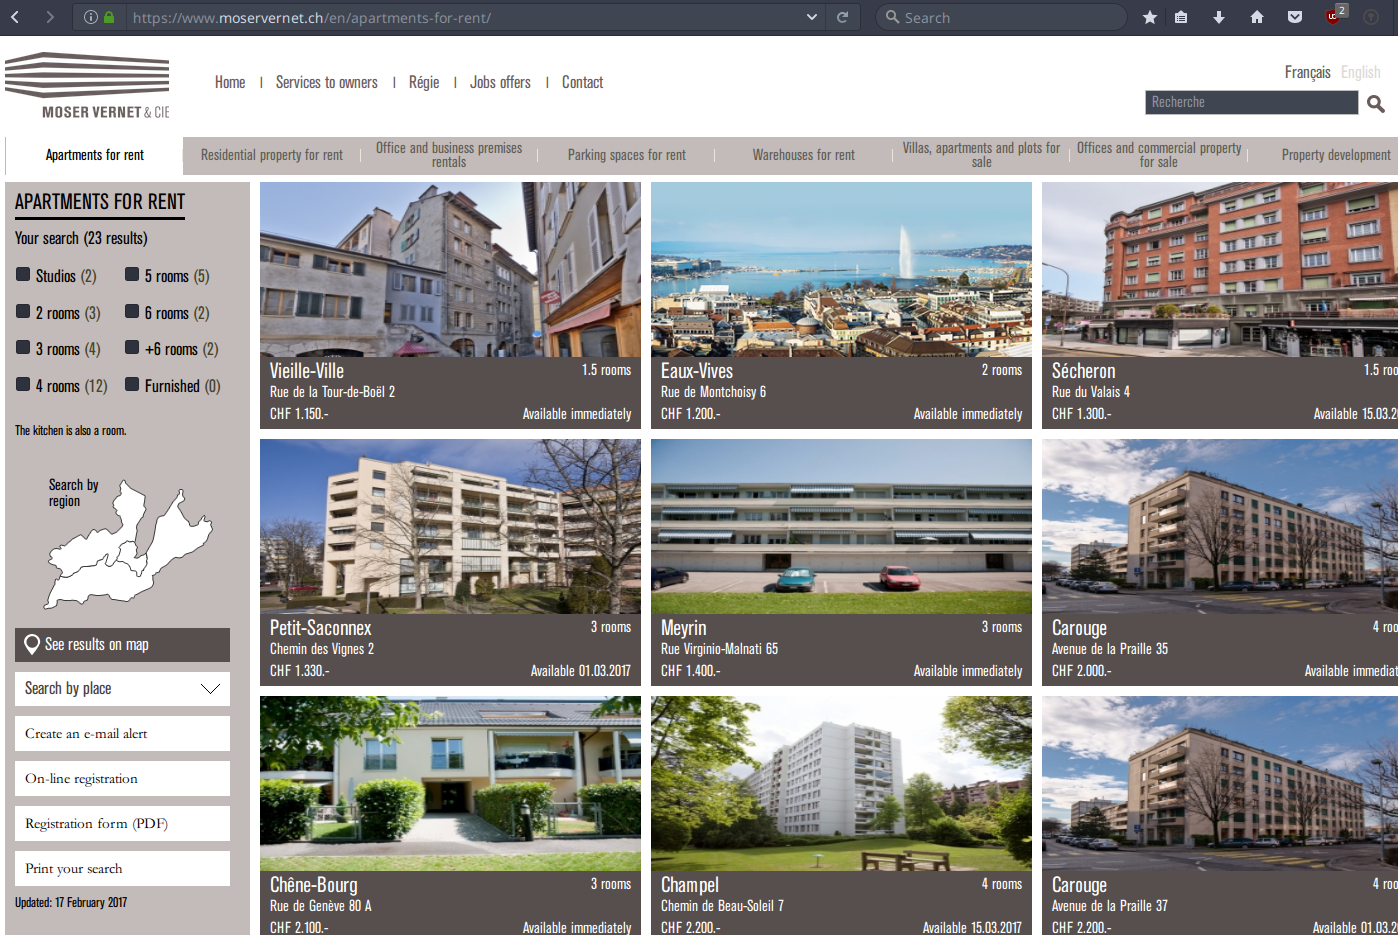
Apartment Rental section on website
Each flat seem to be displayed in its own little box, which should derive from code not to hard to parse. But it would be even easier if the data was grabed from some kind of API.
Looking at the network tab of the inspector, it doesn’t look like we can easily identify an API.
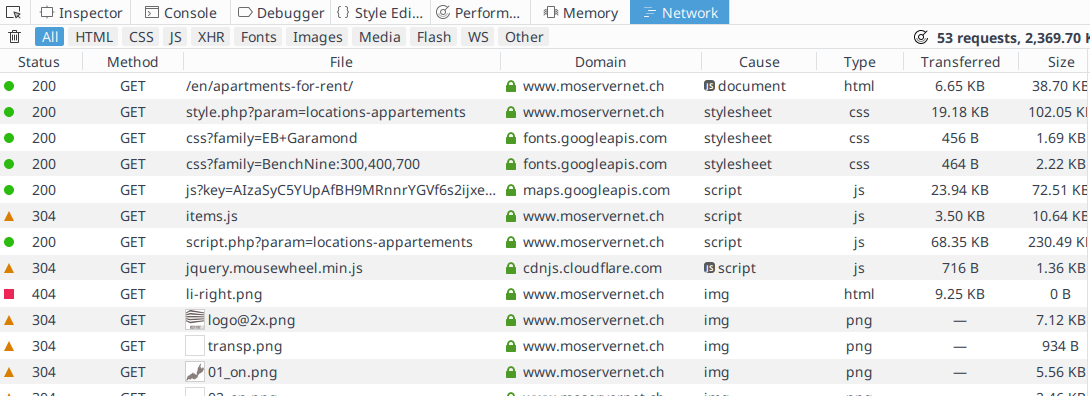
Network tab from inspector tool on Apartment Rental section website
We will need to fall back on scraping.
Looking at the page source, we can see that all the information seem to be present so we won’t need to rely on a headless browser to execute Javascript. The data seems neatly organised.
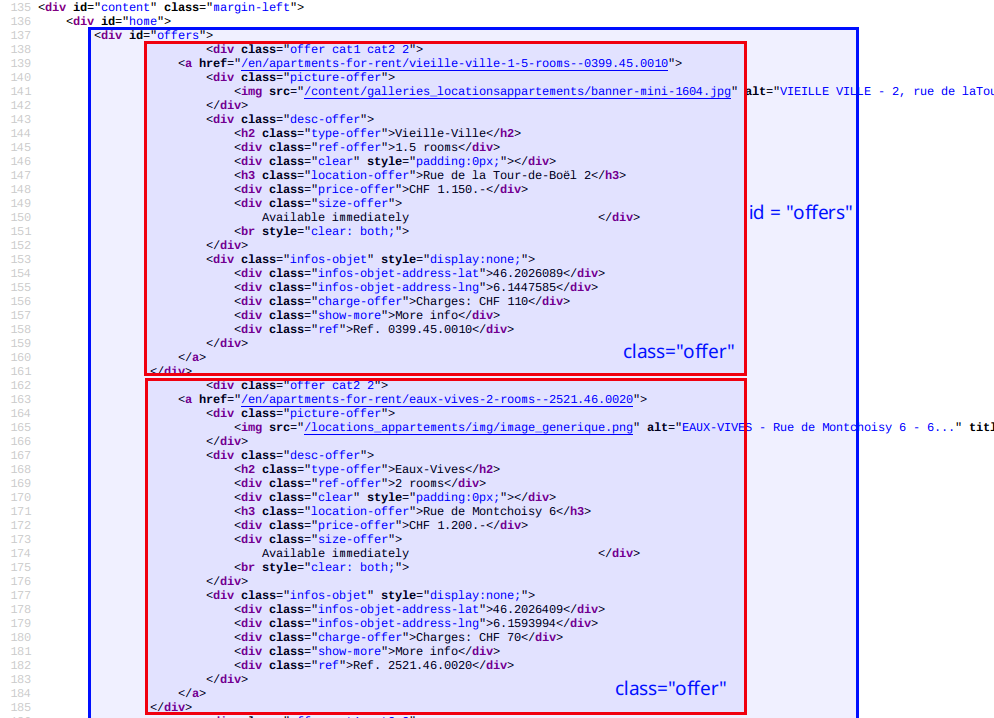 On the screenshot above, we can see that all the apartments are in a
 div with the id=offers (blue rectangle). Then each apartment is contained in its own div with the class=offer (red rectangles). We can also see that the different attributes of each flat are in separated div or h tags, usually with meaningful class like price-offer, charge-offer, size-offer… Very conveniently, and probably because they have a google map applet, the latitude and longitude are already available with the classes info-obj-address-lat and info-obj-address-lng.
Getting the page source into R
Using the rvest library, we can grab the code of the site.
# Load needed packages
suppressMessages(library(dplyr))
suppressMessages(library(xml2))
suppressMessages(library(rvest))
# Create an html document
listing_url <- "https://www.moservernet.ch/en/apartments-for-rent/"
listing_html <- xml2::read_html(listing_url)
listing_html## {xml_document}
## <html>
## [1] <head>\n<meta http-equiv="Content-Type" content="text/html;charset=u ...
## [2] <body>\n\t\t<div id="main">\t\n\t\t\t<div class="container" style="h ...Isolate the html for the offers
Then we isolate the nodes with class=offer contained in the div with id=offers.
listing_offers <- listing_html %>%
  rvest::html_nodes("#offers .offer")
head(listing_offers)
## {xml_nodeset (6)}
## [1] <div class="offer cat1 cat2 2">\n\t\t\t\t\t<a href="/en/apartments-f ...
## [2] <div class="offer cat1 cat2 2">\n\t\t\t\t\t<a href="/en/apartments-f ...
## [3] <div class="offer cat1 cat2 2">\n\t\t\t\t\t<a href="/en/apartments-f ...
## [4] <div class="offer cat1 cat2 1">\n\t\t\t\t\t<a href="/en/apartments-f ...
## [5] <div class="offer cat2 2">\n\t\t\t\t\t<a href="/en/apartments-for-re ...
## [6] <div class="offer cat2 3">\n\t\t\t\t\t<a href="/en/apartments-for-re ...Parsing the offers
Now that we have a list of offers, we need to find a way to extract the data of interest from each offer and store it in a usable format. There are at least two way to proceed: a “field centric” way and an “offer centric” way.
Parsing with the “field centric” way
In the “field centric” way, we grab one field of interest (rent, rooms, address…) at a time for all the offers. We end up with vectors containing the value of the field for each offer. These vector can then be combined into a dataframe. The “field centric” way is described in the lego movie example on rvest’s github repo
id and address can be stored as text and only need a bit of cleanup.
id <- listing_offers %>%
  rvest::html_nodes(".ref") %>%
  rvest::html_text() %>%
  stringr::str_replace("Ref. ","")

address <- listing_offers %>%
  rvest::html_nodes(".location-offer") %>%
rvest::html_text()rooms, latitude, longitude, rent and charges are better saved as numeric after removal of prefix/suffix like currencies. Note that stringr’s str_replace can search for regular expressions pattern, which let us do things like removing room and rooms in one call.
rooms <- listing_offers %>%
  rvest::html_nodes(".ref-offer") %>%
  rvest::html_text() %>%
  stringr::str_replace(" room[s]*","") %>%
  as.numeric()

latitude <- listing_offers %>%
  rvest::html_nodes(".infos-objet-address-lat") %>%
  rvest::html_text() %>%
  as.numeric()

longitude <- listing_offers %>%
  rvest::html_nodes(".infos-objet-address-lng") %>%
  rvest::html_text() %>%
  as.numeric()

rent <- listing_offers %>%
  rvest::html_nodes(".price-offer") %>%
  rvest::html_text() %>%
  stringr::str_replace("CHF ","") %>%
  stringr::str_replace_all("[.]","") %>%
  stringr::str_replace("[-]","") %>%
  as.numeric()

charges <- listing_offers %>%
  rvest::html_nodes(".charge-offer") %>%
  rvest::html_text() %>%
  stringr::str_replace("Charges: CHF ","") %>%
  stringr::str_replace_all("[.]","") %>%
  stringr::str_replace("[-]","") %>%
  as.numeric()
All these vectors can then be combined in a dataframe, which is nicely displayed in an interactive datatable.
offers <- data.frame(id,
                     rooms,
                     address,
                     latitude,
                     longitude,
                     rent,
                     charges)

library(DT)
DT::datatable(
  offers,
  options = list(pageLength = 5, dom = 'tpi'),
  rownames = FALSE,
  caption = "Table 1 : Offers scraped using the field centric way")
Parsing with the “offer centric” way
In the “offer centric” way, we parse one offer at a time, extract all the fields of interest and store it into a list. We end up with a list of lists, where each list contain all the fields for one offer.
To parse each offer, we are going to create a function parse_offer that works well on one offer and apply it to each offer with the help of the purrr package.
Note that we are searching only for one value, so we use html_node and not html_nodes.
parse_offer <- function(offer) {
  list(
    id = offer %>%
      rvest::html_node(".ref") %>%
      rvest::html_text() %>%
      stringr::str_replace("Ref. ",""),

    address = offer %>%
      rvest::html_node(".location-offer") %>%
      rvest::html_text(),

    room = offer %>%
      rvest::html_node(".ref-offer") %>%
      rvest::html_text() %>%
      stringr::str_replace(" room[s]*","") %>%
      as.numeric(),

    latitude = offer %>%
      rvest::html_node(".infos-objet-address-lat") %>%
      rvest::html_text() %>%
      as.numeric(),

    longitude = offer %>%
      rvest::html_node(".infos-objet-address-lng") %>%
      rvest::html_text() %>%
      as.numeric(),

    rent = offer %>%
      rvest::html_node(".price-offer") %>%
      rvest::html_text() %>%
      stringr::str_replace("CHF ","") %>%
      stringr::str_replace_all("[.]","") %>%
      stringr::str_replace("[-]","") %>%
      as.numeric(),

    charges = offer %>%
      rvest::html_node(".charge-offer") %>%
      rvest::html_text() %>%
      stringr::str_replace("Charges: CHF ","") %>%
      stringr::str_replace_all("[.]","") %>%
      stringr::str_replace("[-]","") %>%
      as.numeric()
  )
}
purrr::map will create a list of lists. Each list in the list of lists can be bound as a row in a dataframe, thanks to dplyr::bind_rows().
suppressMessages(library(purrr))

offers <- listing_offers %>%
  purrr::map(parse_offer) %>%
  dplyr::bind_rows() %>%
  na.omit()

DT::datatable(
  offers,
  options = list(pageLength = 5, dom = 'tpi'),
  rownames = FALSE,
  caption = "Table 2 : Offers scraped using the offer centric way")
Visualize the data
Looking at bivariate relationship
We can check if rent and charges seem to be correlated.
suppressMessages(library(ggplot2))
suppressMessages(library(hrbrthemes))

offers_no_outliers <- filter(offers, rent < 10000)

offers_no_outliers %>%
  ggplot(aes(x=rent, y=charges)) +
  geom_jitter(alpha=0.5) +
  geom_smooth(method = "lm", size=0.5, se = F, color="black") +
  annotate(geom="label",
           x=max(offers$rent), y=min(offers$charges),
           label=paste(
             "r(rent, charge) =",
             round(cor(offers_no_outliers$rent,
                       offers_no_outliers$charges), 3)),
           hjust=1, fill="black", alpha="0.5", color="white") +
  labs(title=stringr::str_to_title("Do charges go up with rent?"),
       subtitle="There seems to be a positive linear relationship between rent and charges.") +
  theme_ipsum_tw()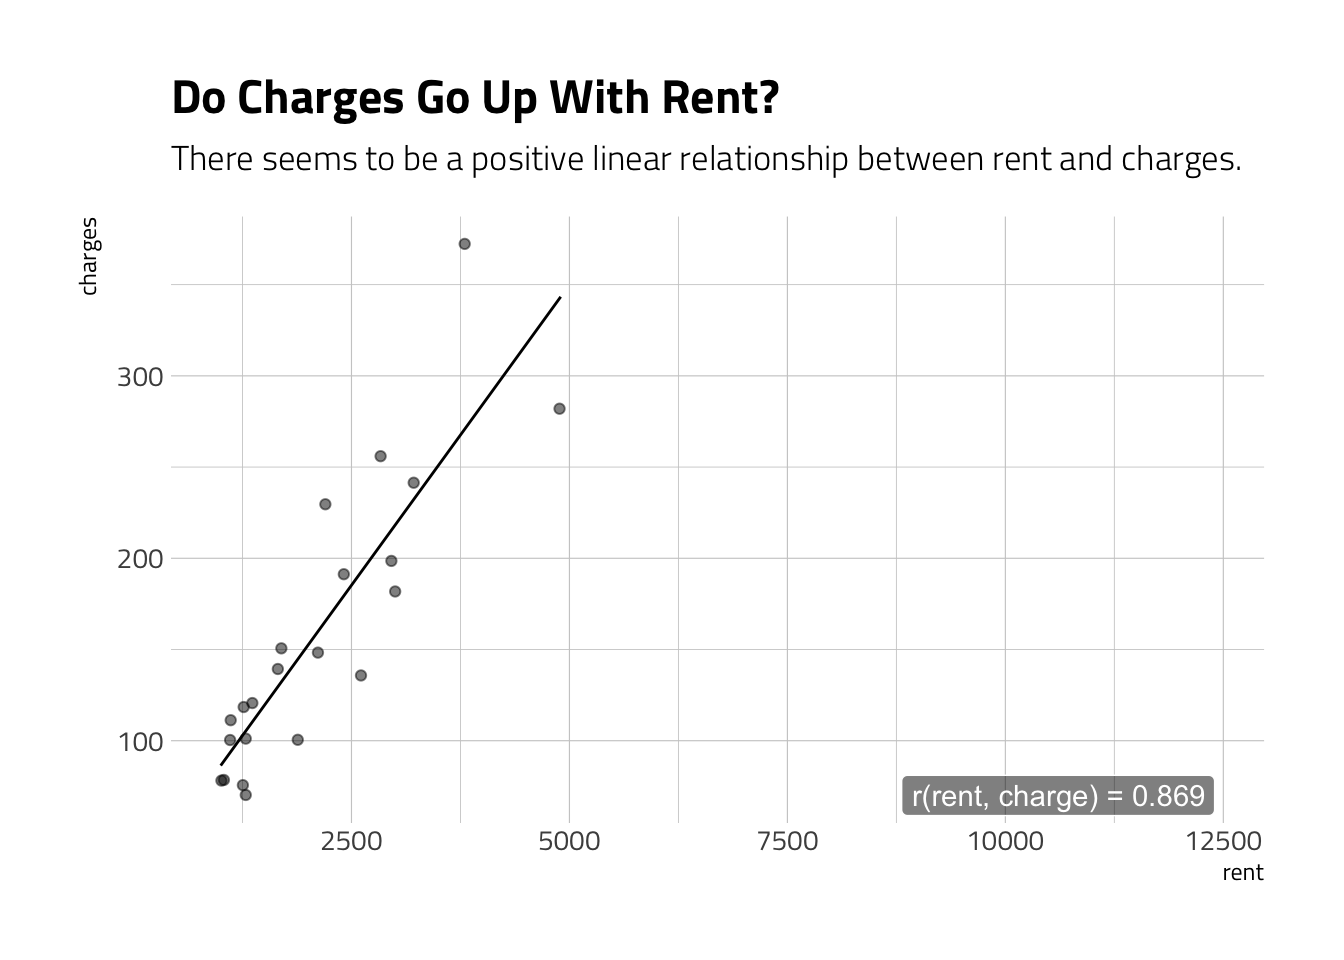
Seeing the results on a map
Lastly, because latitude and longitude were so easily obtained, we can pin each flat on a leaflet map.
suppressMessages(library(leaflet))

m <- leaflet(offers) %>%
  addProviderTiles("CartoDB.Positron") %>%
  addMarkers(lng=~longitude,
             lat=~latitude,
             popup=offers$address)
m